tls-spatial-bulk
One expression-only model that reads tertiary lymphoid structures (TLS) from a Visium spot or a bulk RNA-seq sample: no TLS / TLS plus a calibrated confidence, one sample at a time.
Why
What a TLS is. An ectopic lymphoid organ that forms de novo inside chronically inflamed tissue, tumours included: a B-cell follicle (mature TLS: with a germinal centre and follicular dendritic cells), a T-cell zone and high endothelial venules. Inside the tumour it primes T cells and produces plasma cells and antibodies against the tumour.
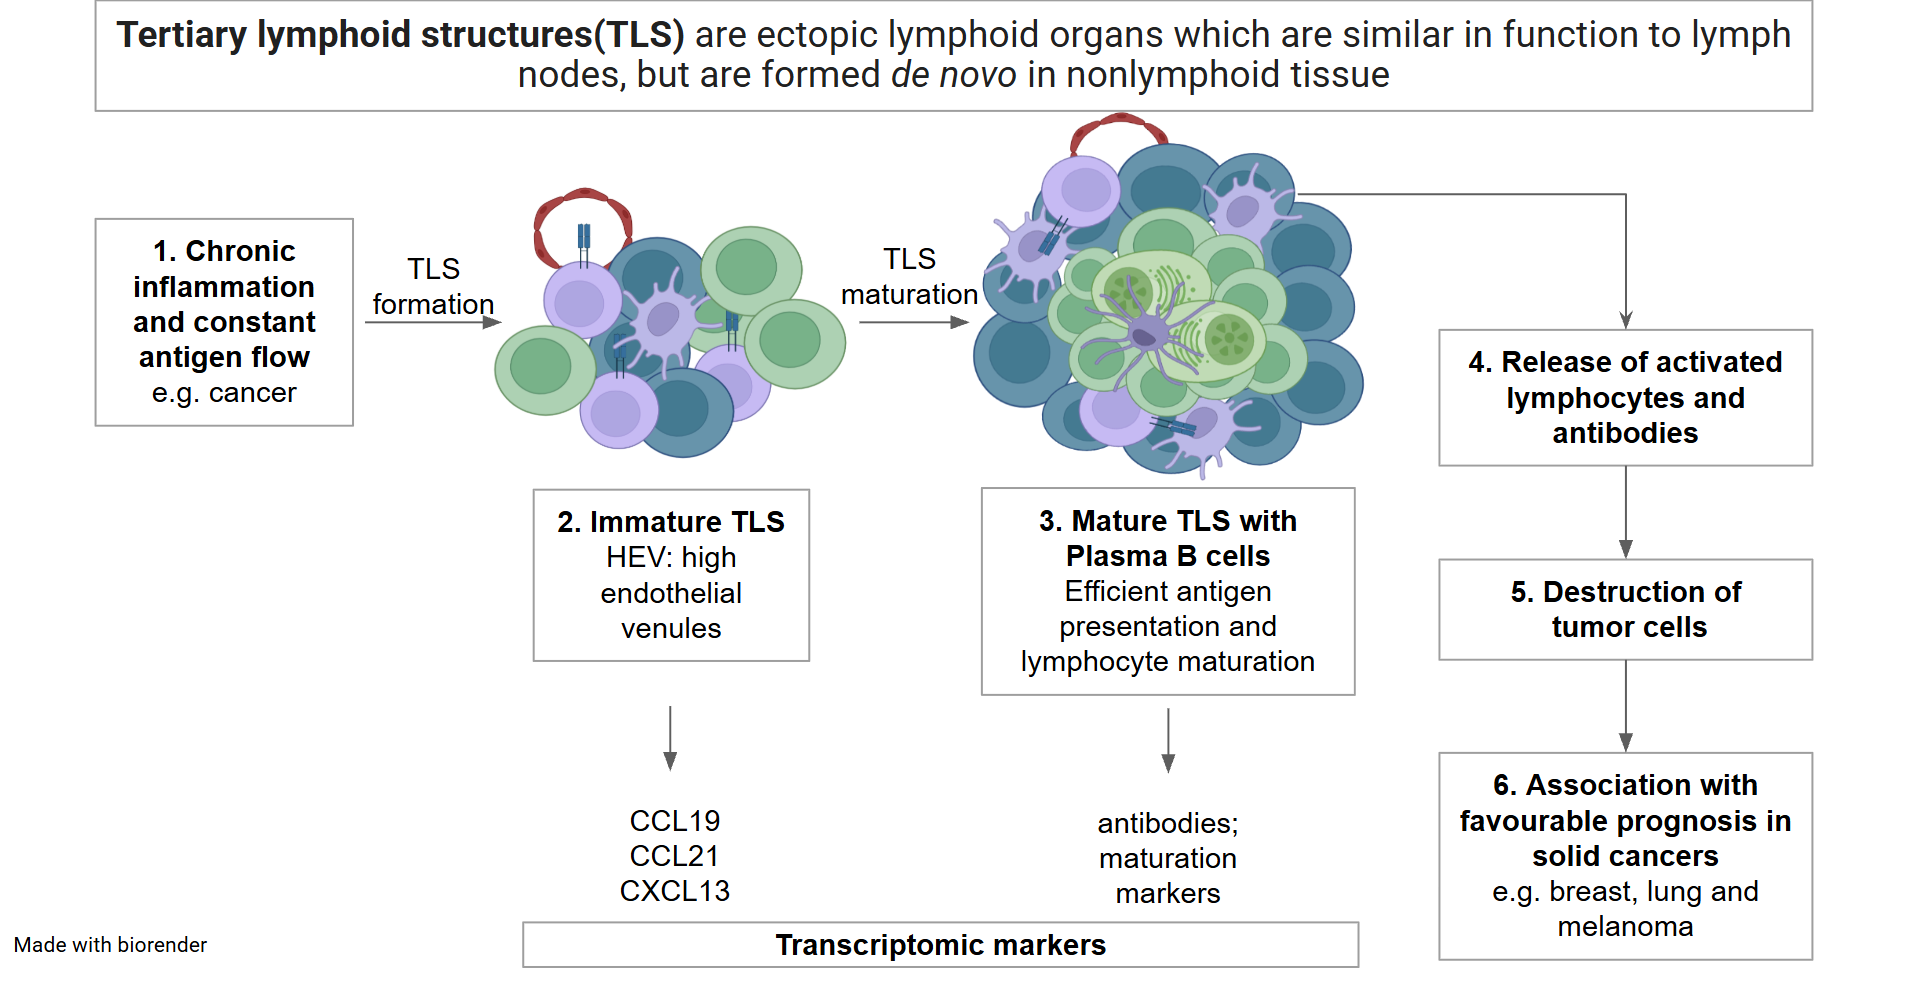
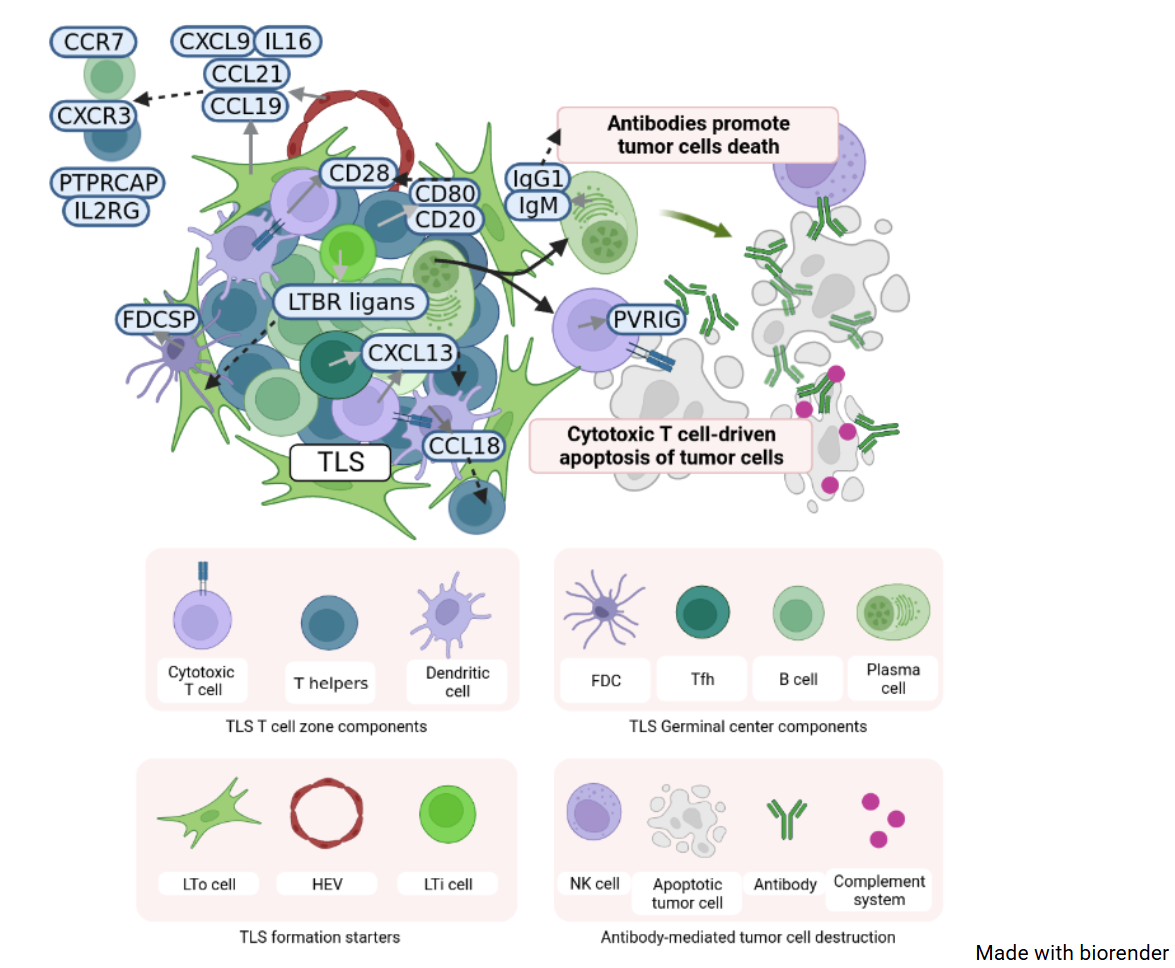
Why it matters. TLS are an immunotherapy biomarker that adds to the ones used today. In 540 tumours treated with anti-PD-1 / PD-L1, mature TLS predicted objective response (43.1 % vs 19.6 %), PFS and OS independently of PD-L1 and CD8 density (Vanhersecke et al., Nat Cancer 2021, doi:10.1038/s43018-021-00232-6); in a small subset (n = 70) the mature-TLS rate did not differ by TMB.
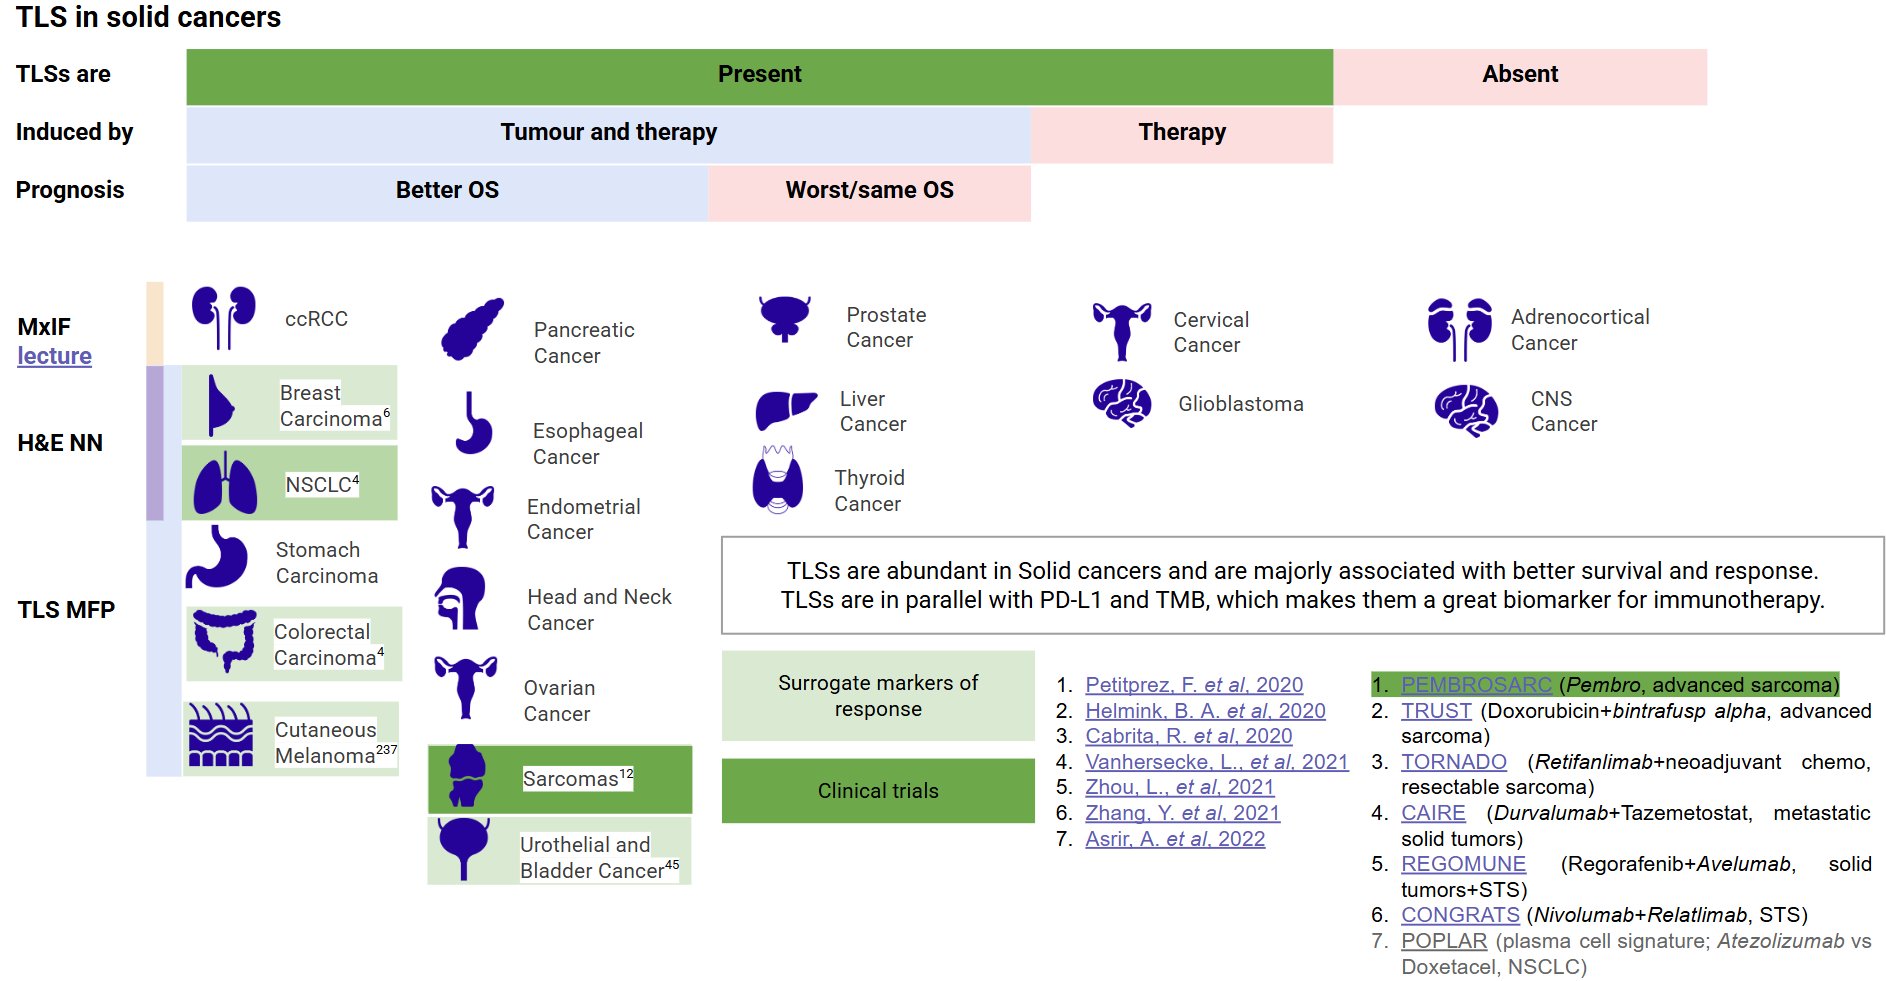
The gap. TLS are scored on H&E / multiplex IF or with spatial transcriptomics: accurate, but slow and expensive. Bulk RNA-seq is routine, yet bulk TLS signatures are imprecise: inside one cohort the published signatures reach an AUROC of only ~0.6 against pathologist calls (this repo, CV).
This project trains one model on both worlds: spot-level TLS annotation from spatial transcriptomics and pathologist TLS calls on bulk samples, on shared single-sample features, so the same model scores a spot or a bulk sample.
Key numbers
All values: 95 % bootstrap CI; test and OOD patients were never seen in training.
| evaluation | n (TLS+) | AUROC |
|---|---|---|
| Visium spots, held-out patients | 25,206 spots (374), 7 patients | 0.930 [0.886, 0.960] |
| Bulk, held-out patients, all cohorts pooled | 162 (80) | 0.757 [0.679, 0.827] |
| Bulk, held-out patients, within one cohort | 17–45 per cohort | 0.45–0.70 (wide CIs) |
| OOD, Internal lung (local data, not in repo) | 47 (17) | 0.855 [0.742, 0.950] |
| OOD, CPTAC-PAAD | 129 (54) | 0.641 [0.543, 0.738] |
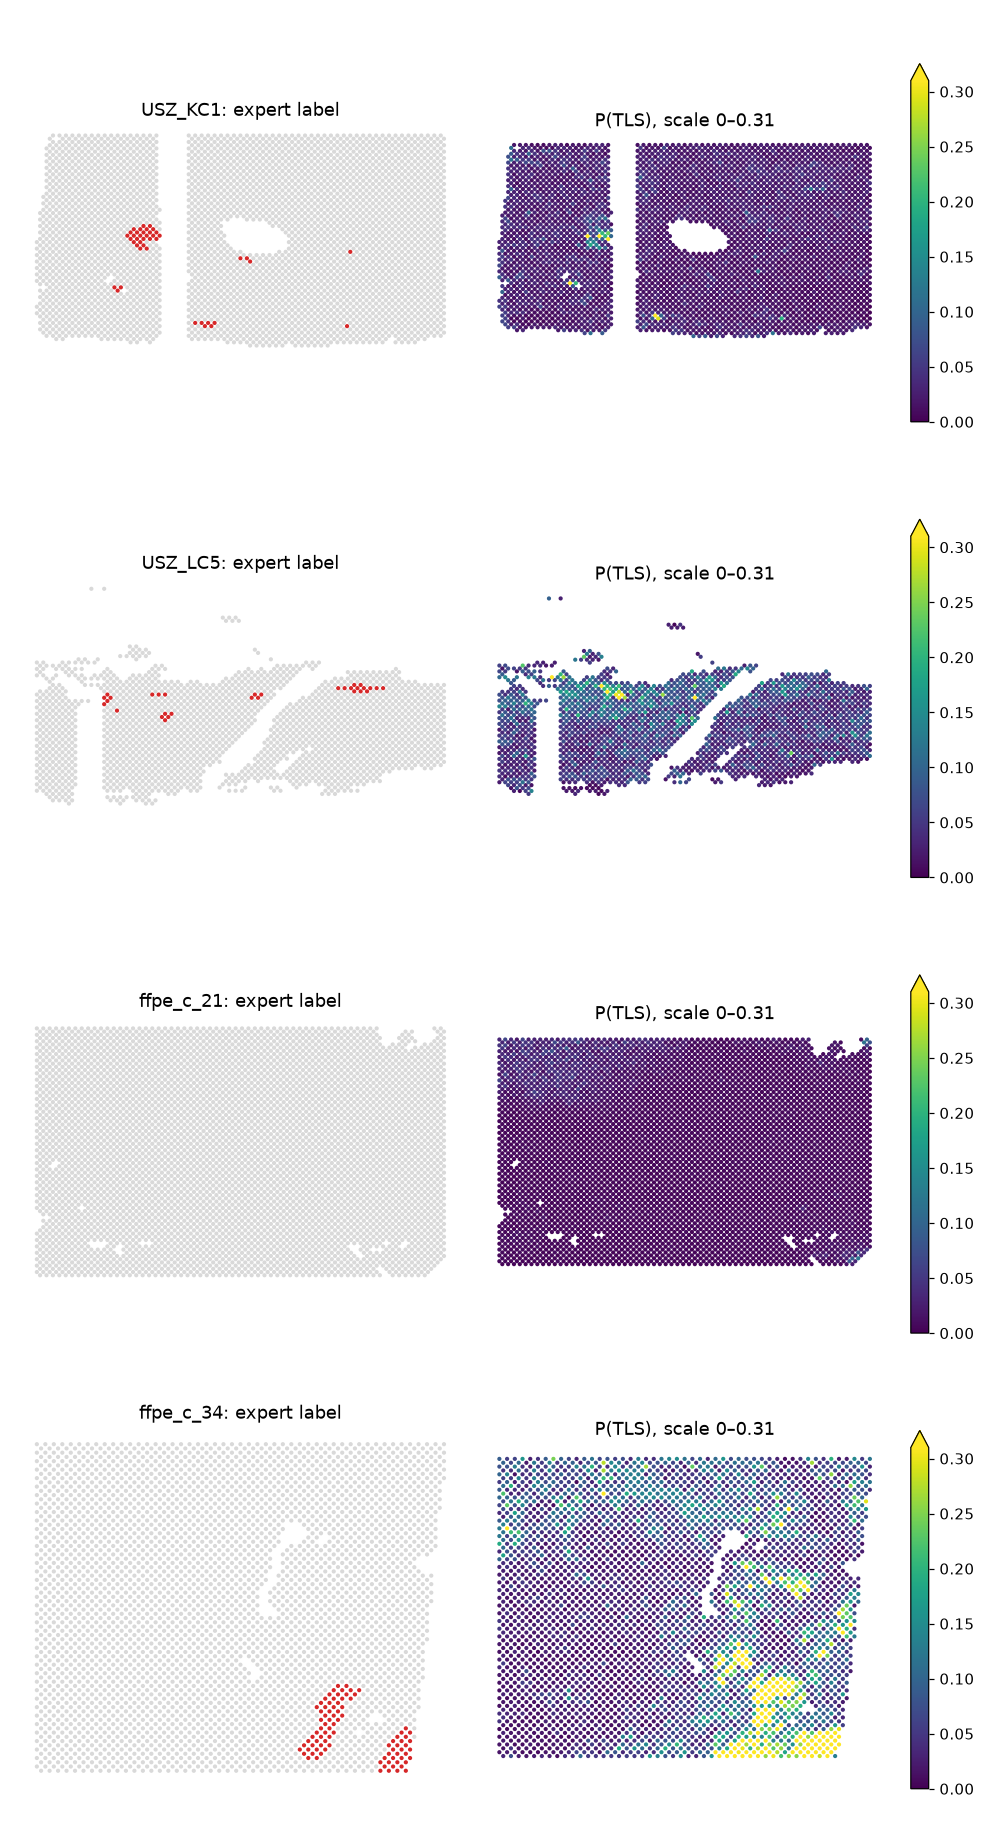
Predicted P(TLS) on held-out Visium sections (patients never seen in training); one colour scale for all sections, capped at the 99th percentile because TLS cover only ~4 % of spots:
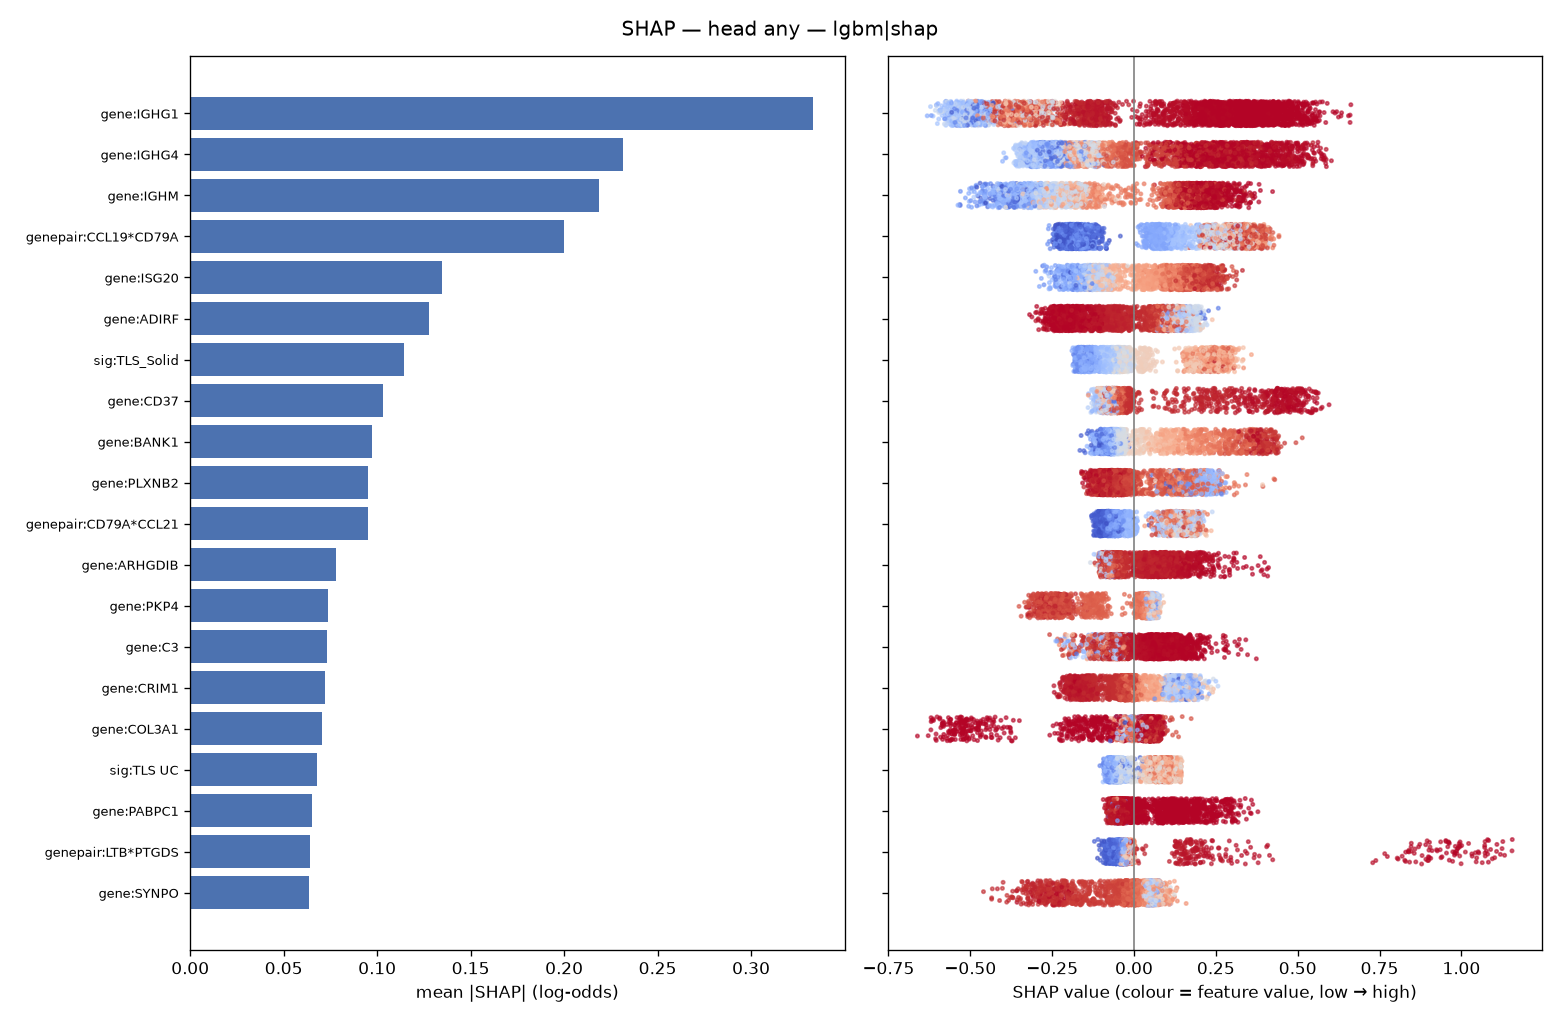
What the model uses (final LightGBM model, top-20 features; left: mean |SHAP|, right: SHAP per unit coloured by feature value). Immunoglobulin genes (IGHG1, IGHG4, IGHM) and B-cell / TLS chemokine pairs (CCL19 × CD79A) lead:
Interactive ROC curves per cohort (our model vs the published signatures) and a UMAP of the immunotherapy samples: online report.
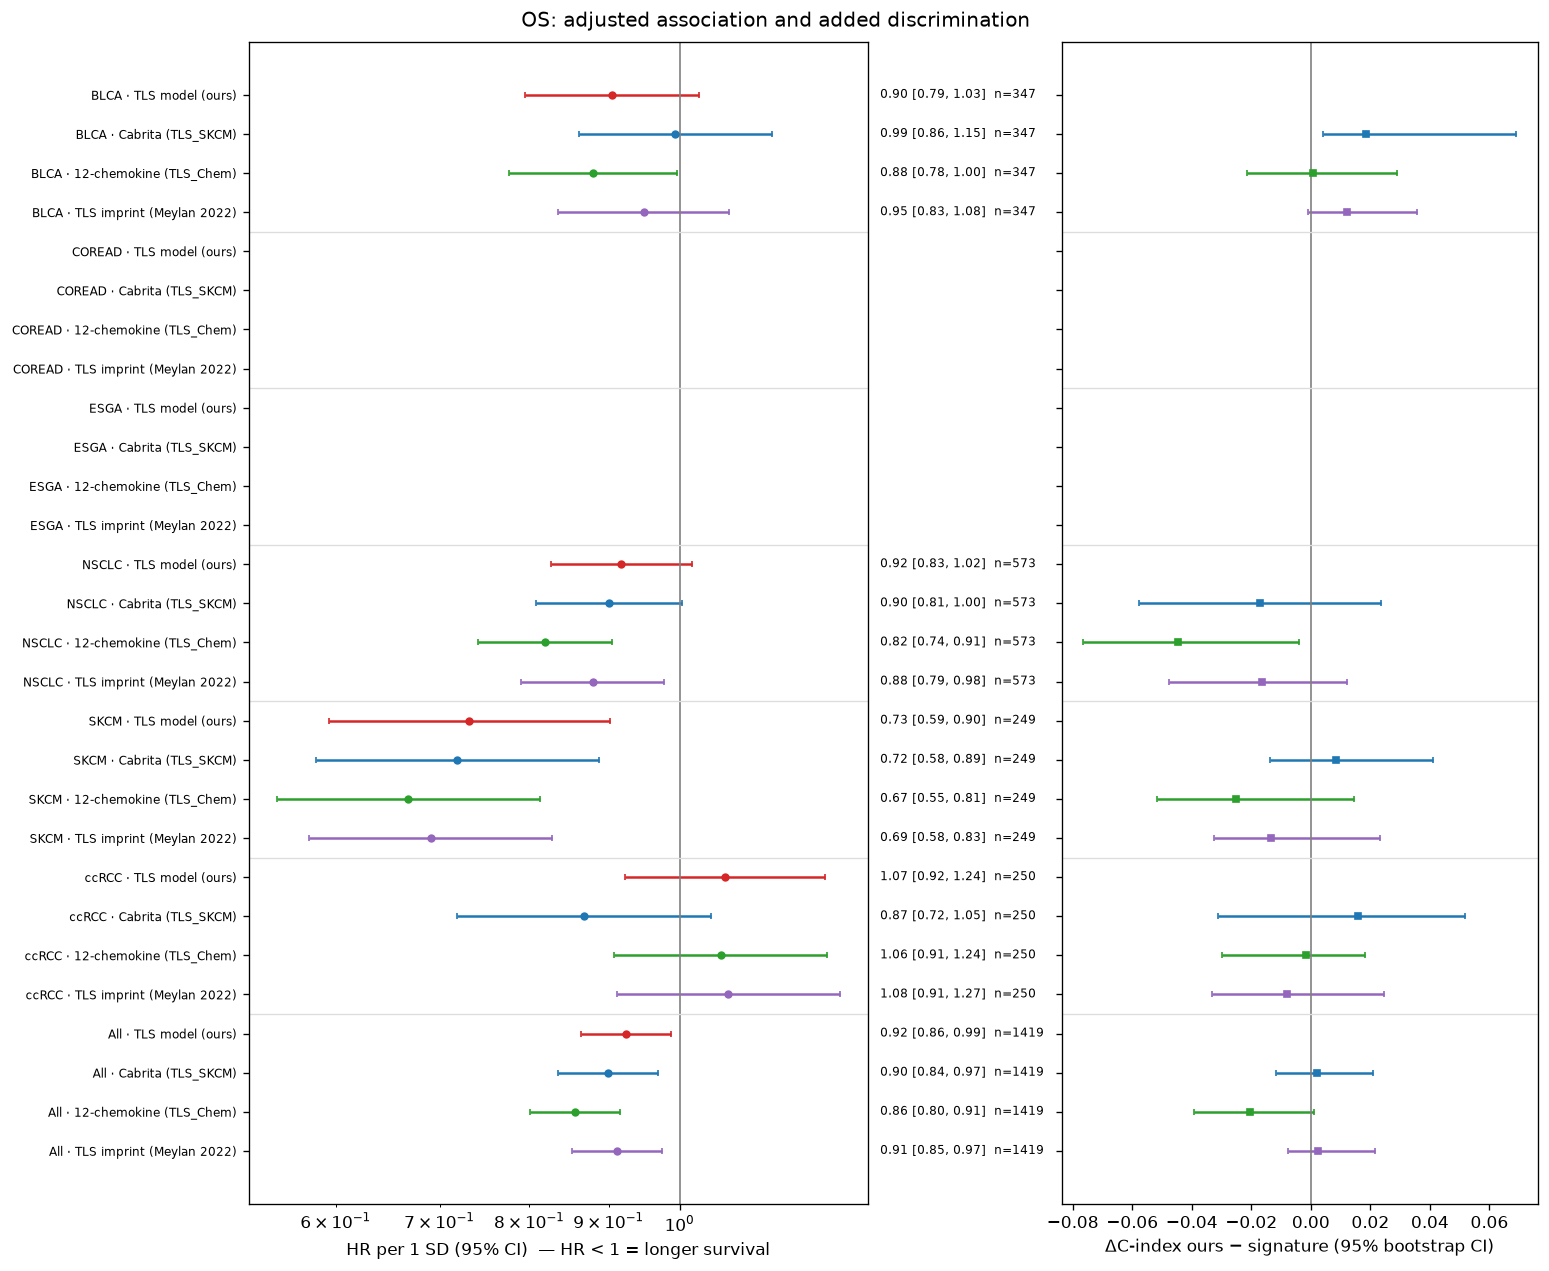
Immunotherapy cohorts (2,689 ICI-treated patients, 6 cancer types; adjusted Cox / logistic models vs three
published TLS signatures, results/ici/): a higher TLS score goes with longer OS / PFS and more responses, but
the effect is small (pooled OS HR 0.92 per SD), and the model is not better than the 12-chemokine signature —
it adds nothing on top of it (likelihood-ratio tests ≈ null). An interaction of the two scores is a hypothesis
only (bladder IMvigor210 and ccRCC, not corrected for multiplicity).
 Limitations. Spots work, bulk within one cohort is weak (~0.55–0.65 for every model family, signatures
included). Bulk probabilities over-call TLS on a new cohort — use the ranking there. No maturity output: the
maturity head showed no signal and was removed.
Data and splits
| block | source | train | test | OOD |
|---|---|---|---|---|
| Visium, GSE175540 (ccRCC, FFPE + frozen; Meylan Immunity 2022) | GEO | 17 patients · 18 sections · 49,861 spots (2,023 TLS) | 5 · 5 · 19,499 (301) | – |
| Visium, USZ (kidney + lung FFPE; Zenodo 14620362, CC-BY-4.0) | Zenodo | 6 · 6 · 18,539 (852) | 2 · 2 · 5,707 (73) | – |
| TCGA-LUAD | TCGA | 406 (313) | 45 (32) | – |
| TCGA-BRCA | TCGA | 389 (185) | 31 (18) | – |
| TCGA-KIRC/KIRP/KICH | TCGA | 168 (18) | 42 (5) | – |
| TCGA-PAAD | TCGA | 94 (71) | 24 (18) | – |
| CPTAC-ccRCC | CPTAC | 69 (20) | 17 (5) | – |
| MGH LUAD (local, not in repo) | non-public | 9 (7) | 3 (2) | – |
| CPTAC-PAAD | CPTAC | – | – | 129 (54) |
| Internal lung (local, not in repo) | non-public | – | – | 47 (17) |
Bulk cells: samples (TLS+). Splits are by patient; test metrics use pathologist labels only (HookNet-TLS CNN labels are
train-only). Public bulk expression + labels are in data/bulk/; Visium is downloaded by notebook 01; non-public
cohorts and the immunotherapy cohorts live in data/private/ (gitignored) — the pipeline runs without them.
Install
uv sync                 # Python 3.12
uv run pytest -q        # unit tests incl. "no OOD / test patient in train" and repo hygiene
Use
Run the notebooks top to bottom (uv run jupyter lab); every step is idempotent and all paths live in
config.yaml.
| notebook | does |
|---|---|
01_load_visium |
downloads GEO + Zenodo (~3 GB), one AnnData per section, QC, label maps |
02_load_bulk |
bulk cohorts + labels, label-agreement ceiling, builds the unit table |
03_train |
CV model selection, calibration, held-out test, SHAP → models/tls_model.pkl |
04_predict_ood |
OOD cohorts, once; spot maps on held-out sections |
05_ici_validation |
immunotherapy cohorts: response / DCR / OS / PFS vs baseline signatures, forest plots |
Score your own bulk samples (log2(TPM + 1), samples × HUGO genes) with the trained model:
import json, pickle
import pandas as pd
from tls_model import io_ici

log_tpm = pd.read_csv("my_samples.tsv", sep="\t", index_col=0)          # samples × genes
meta = json.load(open("data/processed/meta.json"))
saved = pickle.load(open("models/tls_model.pkl", "rb"))
p_tls = io_ici.score_tls(log_tpm, meta, saved)                         # calibrated P(TLS) per sample
Methods, the course of the work, all figures, baselines and the survival analysis: report.html, online at
https://onion-42.github.io/tls-spatial-bulk/report.html (interactive ROC and UMAP need an internet connection for plotly.js). Rebuild it after notebook 05 with
uv run python scripts/report_data.py (per-sample inputs → data/private/report/, needs the local cohorts) and
uv run python scripts/build_report.py.
Layout
src/tls_model/   io_visium · io_bulk · io_ici · labels · pseudobulk · features · splits · models · evaluate
                 prepare · pipeline · ici_stats · ici_report
notebooks/       01–05 (executed; no per-sample output of non-public cohorts)
scripts/         build_report.py · report_data.py (report.html)
tests/           pytest
results/         metric tables (tsv), results/ici/, figures
report.html      full report (aggregates + interactive ROC / UMAP; no sample ids)